

SciDraw AI Presents an AI-Native Workflow for Scientific Figures and Data Charts
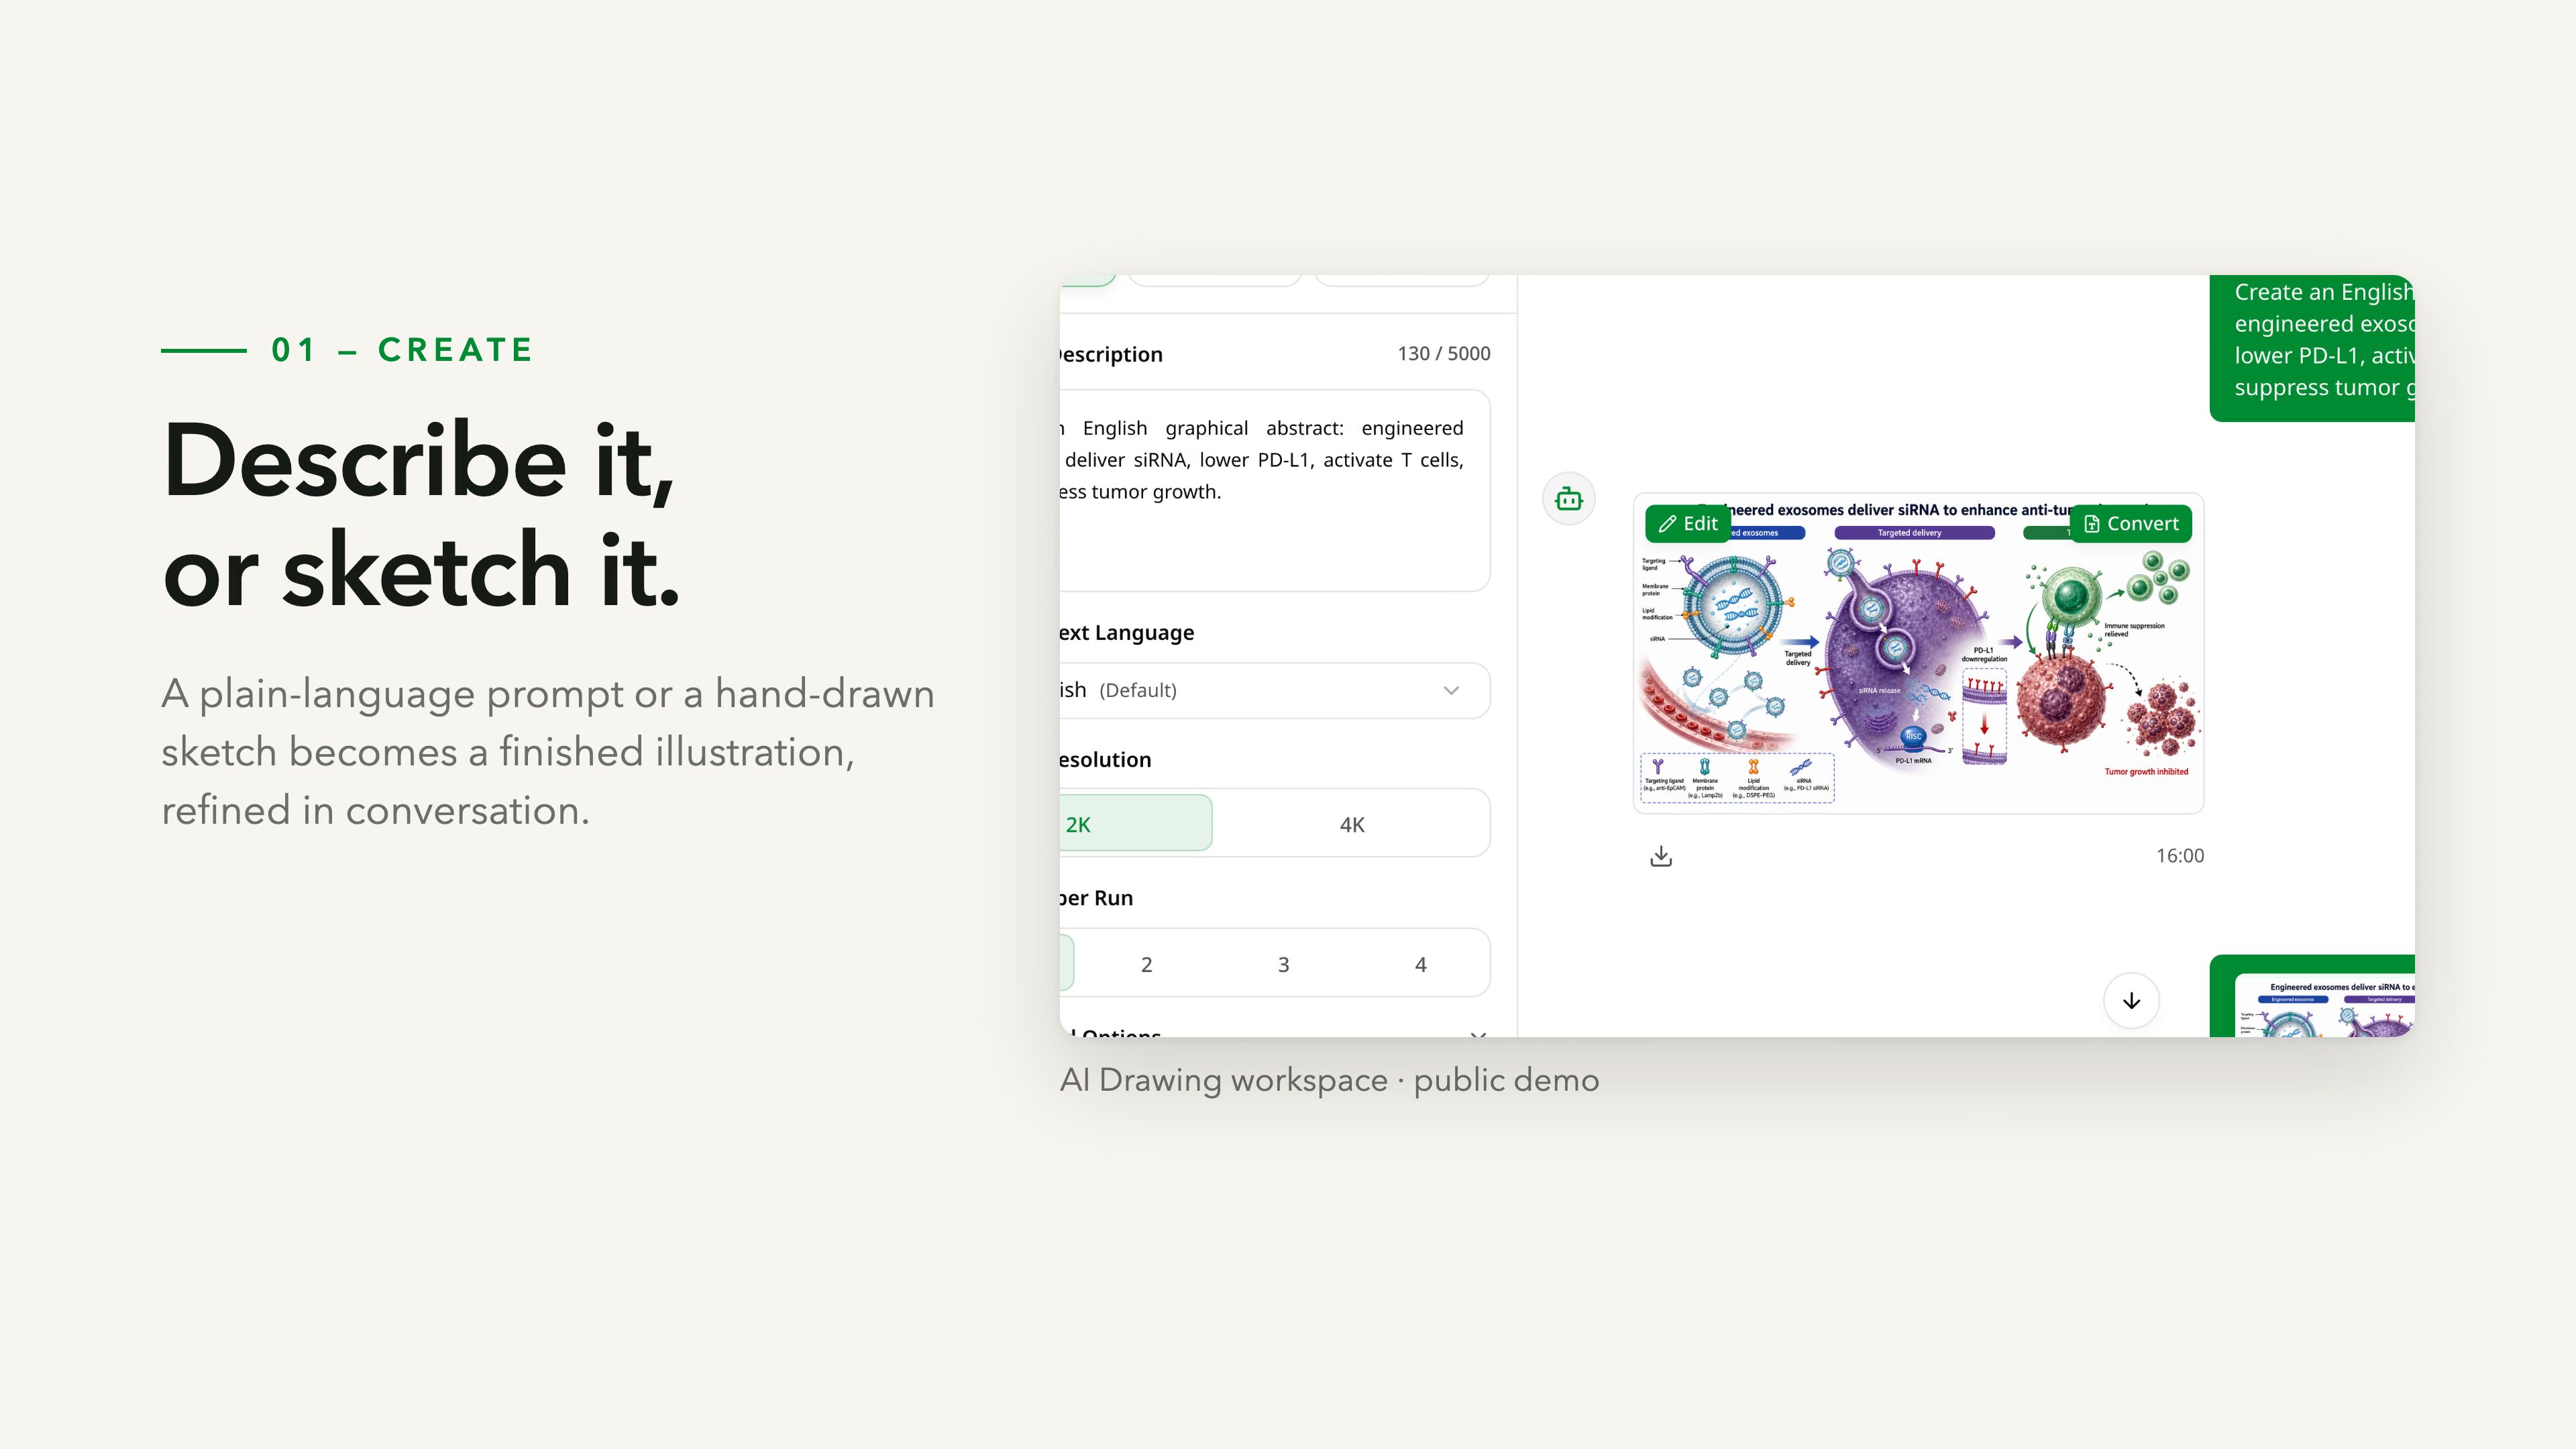
SciDraw AI's public drawing demo illustrates a prompt-based workflow with conversational refinement. Still from the product demonstration video.
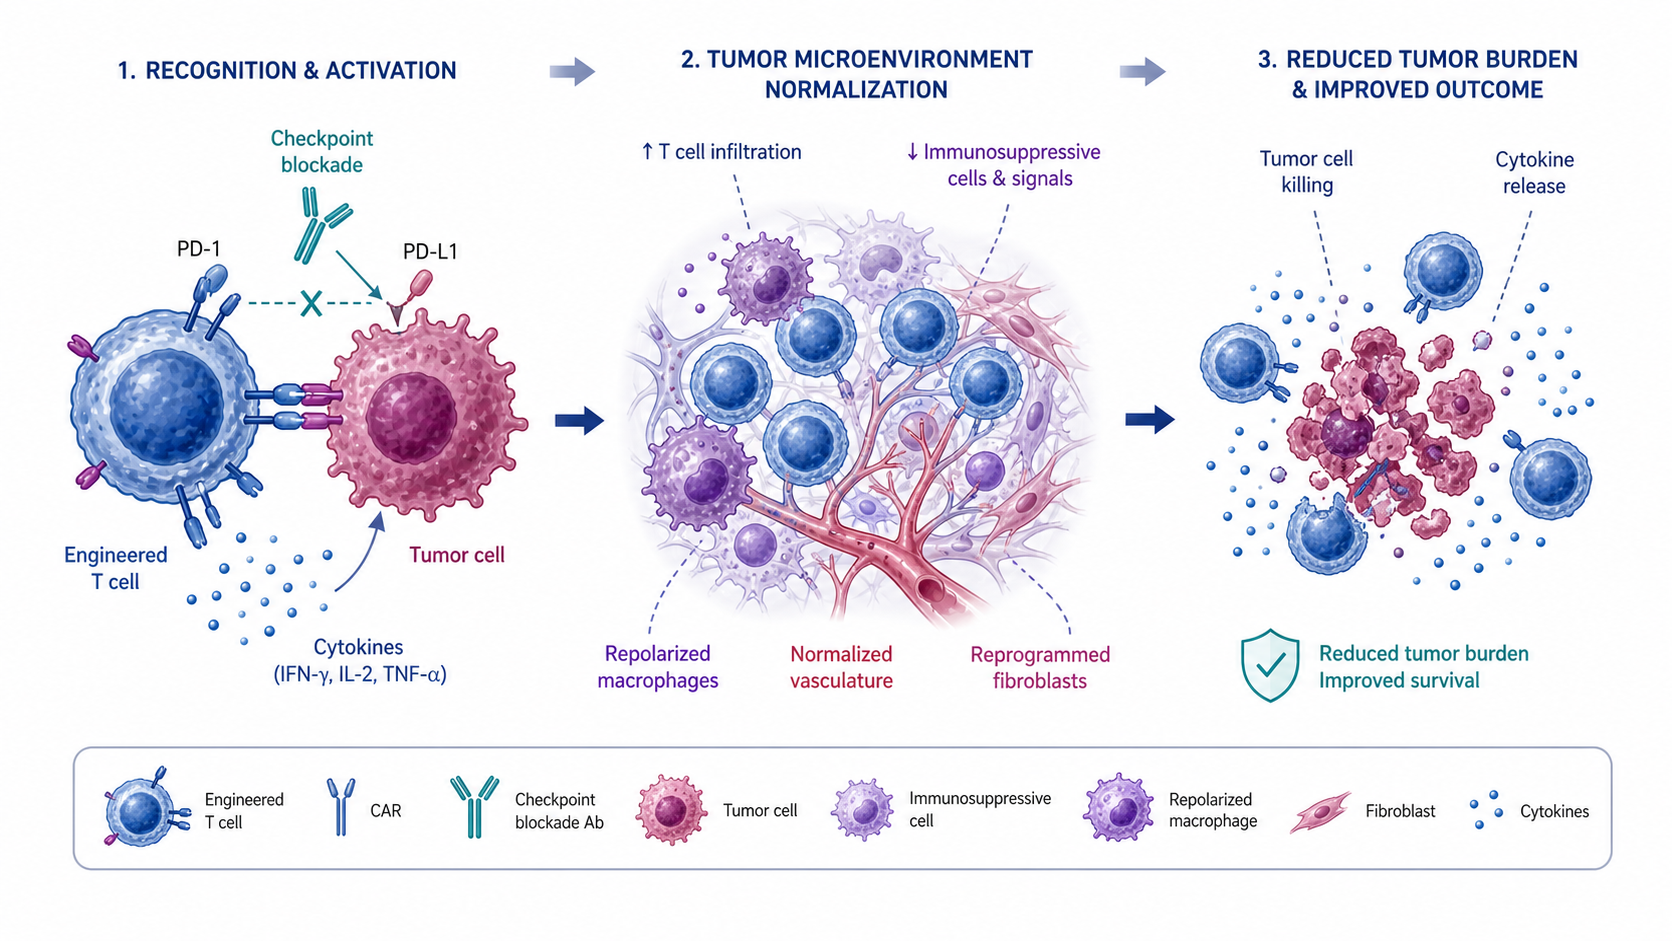
Demonstration graphical abstract illustrating an immunotherapy concept. Shown as a scientific illustration example, not as evidence of clinical results.
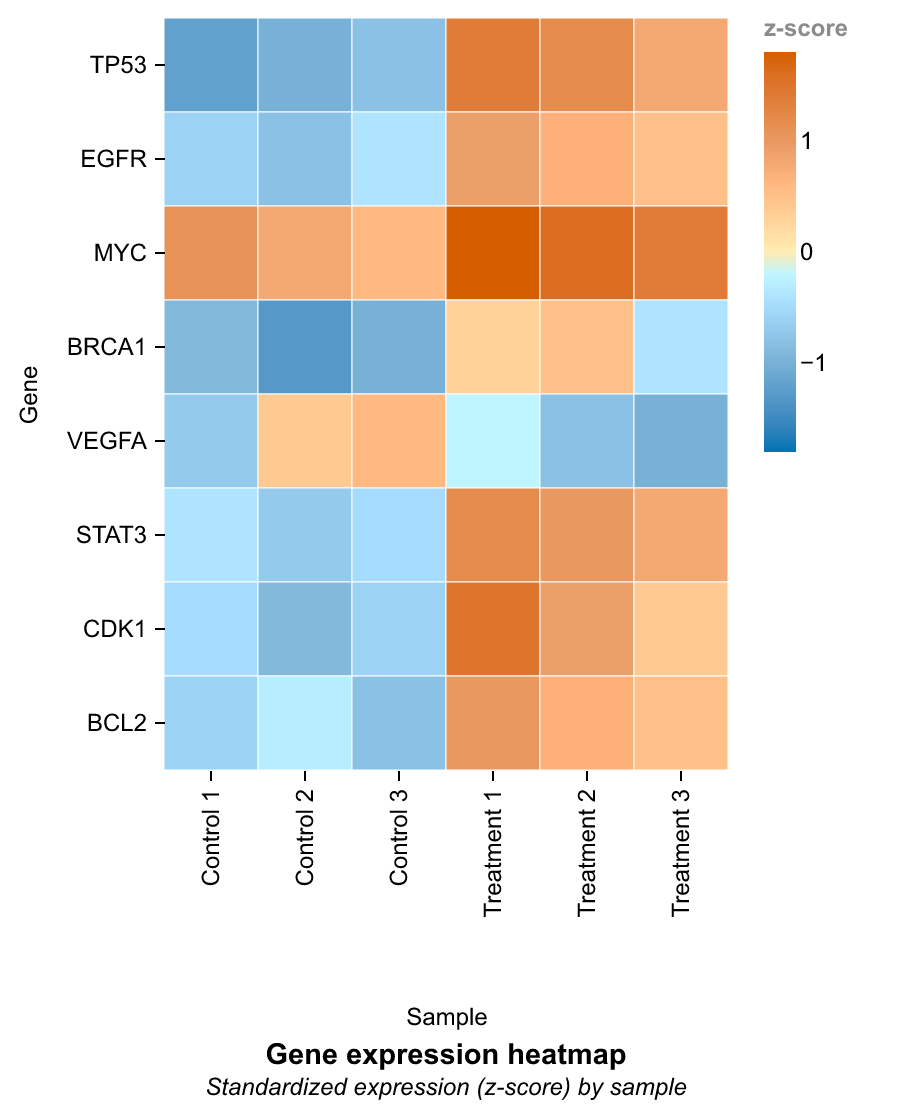
Gene expression heatmap from SciDraw AI's demonstration dataset, illustrating data-driven chart preparation. The data are for demonstration.
From manuscript text and sketches to conversational figure editing, data charts, captions and technical checks, SciDraw AI connects research visual workflows.
NEWARK, DE, UNITED STATES, September 30, 2026 /EINPresswire.com/ -- SciDraw AI presents an AI-native workflow for researchers, graduate students, educators and science communicators who need to turn scientific ideas, manuscript content and tabular data into visual materials. The platform brings scientific illustration, conversational image editing, data visualization and figure preparation into a connected workflow.
Rather than treating AI as a separate step after a figure has been designed, SciDraw AI uses natural-language instructions throughout the creation process. Users can describe a scientific concept, work from a sketch or reference image, and continue refining an existing result through follow-up instructions. Task-specific tools provide starting points for different research and communication needs.
From Manuscripts to Scientific Illustrations
Researchers can start with manuscript text or a PDF through the manuscript-to-figure generator and graphical abstract maker. These tools extract text and help translate the research narrative into a visual prompt that users can review before generating a figure draft. The same paper-to-prompt workflow also supports scientific poster preparation.
The platform's illustration tools address a range of disciplines and visual formats. The scientific figure maker, scientific diagram maker and AI scientific illustration tools support research visuals, while the chemistry diagram generator and reaction mechanism figure generator provide starting points for chemistry-focused illustrations. The biological pathway diagram generator and medical illustration generator support visual explanations of biological processes and medical concepts.
These task-specific entry points are designed to help users describe the figure they need without beginning with an empty canvas. They also connect generated results to the broader drawing workspace for subsequent revision.
Natural-Language Refinement of Existing Figures
SciDraw AI supports text prompts, sketch-based input and reference images. The sketch-to-image tool can use a rough layout as a starting point, while image-to-image AI supports reference-based generation. The AI image editor with prompt lets users request changes to an existing image in natural language and continue working within its conversation.
This approach supports an iterative process: establish an initial visual, review its scientific content and composition, and request further changes. Researchers remain responsible for checking labels, relationships, mechanisms and other details against their source material.
Data Charts Alongside Scientific Illustration
For scientific data visualization, SciDraw AI provides a separate workflow based on uploaded CSV or Excel data. Users can describe the chart they need and refine its presentation through follow-up instructions. The charting system generates and executes plotting code against the uploaded data, rather than treating a data chart as an illustrative image.
Supported chart families include bar, line and scatter plots, box and violin plots, heatmaps, regression plots, volcano plots, survival curves and forest plots. Chart controls and follow-up instructions support adjustments to labels, colors, layout and presentation. Available chart export formats include PNG, PDF, EPS and TIFF.
Preparing Figures for Research Communication
Additional tools address the steps surrounding figure creation. Figure Legend generates draft captions from uploaded figures, including plain-text and LaTeX output. Figure Checker reviews technical properties such as effective resolution, image format and color presentation, with grayscale and color-vision previews to help users assess readability.
Conversion tools provide additional ways to reuse figures. Image-to-SVG offers text-focused conversion or fuller vectorization, while image-to-PowerPoint combines an image background with editable recognized text. The level of editability depends on the conversion method and source image.
The workflow is intended to support manuscripts, graphical abstracts, posters, presentations and teaching materials. AI-generated illustrations and captions require author review, and technical checks do not establish scientific validity or guarantee journal acceptance. Users should also follow the disclosure and image policies of their intended publisher.
Researchers can explore SciDraw AI and its scientific illustration tools at sci-draw.com, including dedicated workflows for manuscript figures, graphical abstracts, scientific diagrams and data charts.
About SciDraw AI
SciDraw AI is a scientific illustration and data visualization platform from TopLocalAI, LLC. It combines AI-assisted visual creation, conversational refinement, data charting and figure preparation tools for research and science communication. More information is available at https://sci-draw.com.
Davie Chen
TopLocalAI, LLC
contact@sci-draw.com
SciDraw AI: From Research Ideas and Data to Scientific Figures
Legal Disclaimer:
EIN Presswire provides this news content "as is" without warranty of any kind. We do not accept any responsibility or liability for the accuracy, content, images, videos, licenses, completeness, legality, or reliability of the information contained in this article. If you have any complaints or copyright issues related to this article, kindly contact the author above.
